Trouble shooting
Connectivity to JIRA issues
Run the following command to verify the connectivity for each configured Jira accounts, also available as a report in the menu Get JIRA Info:
| jirafill account=_all opt=0
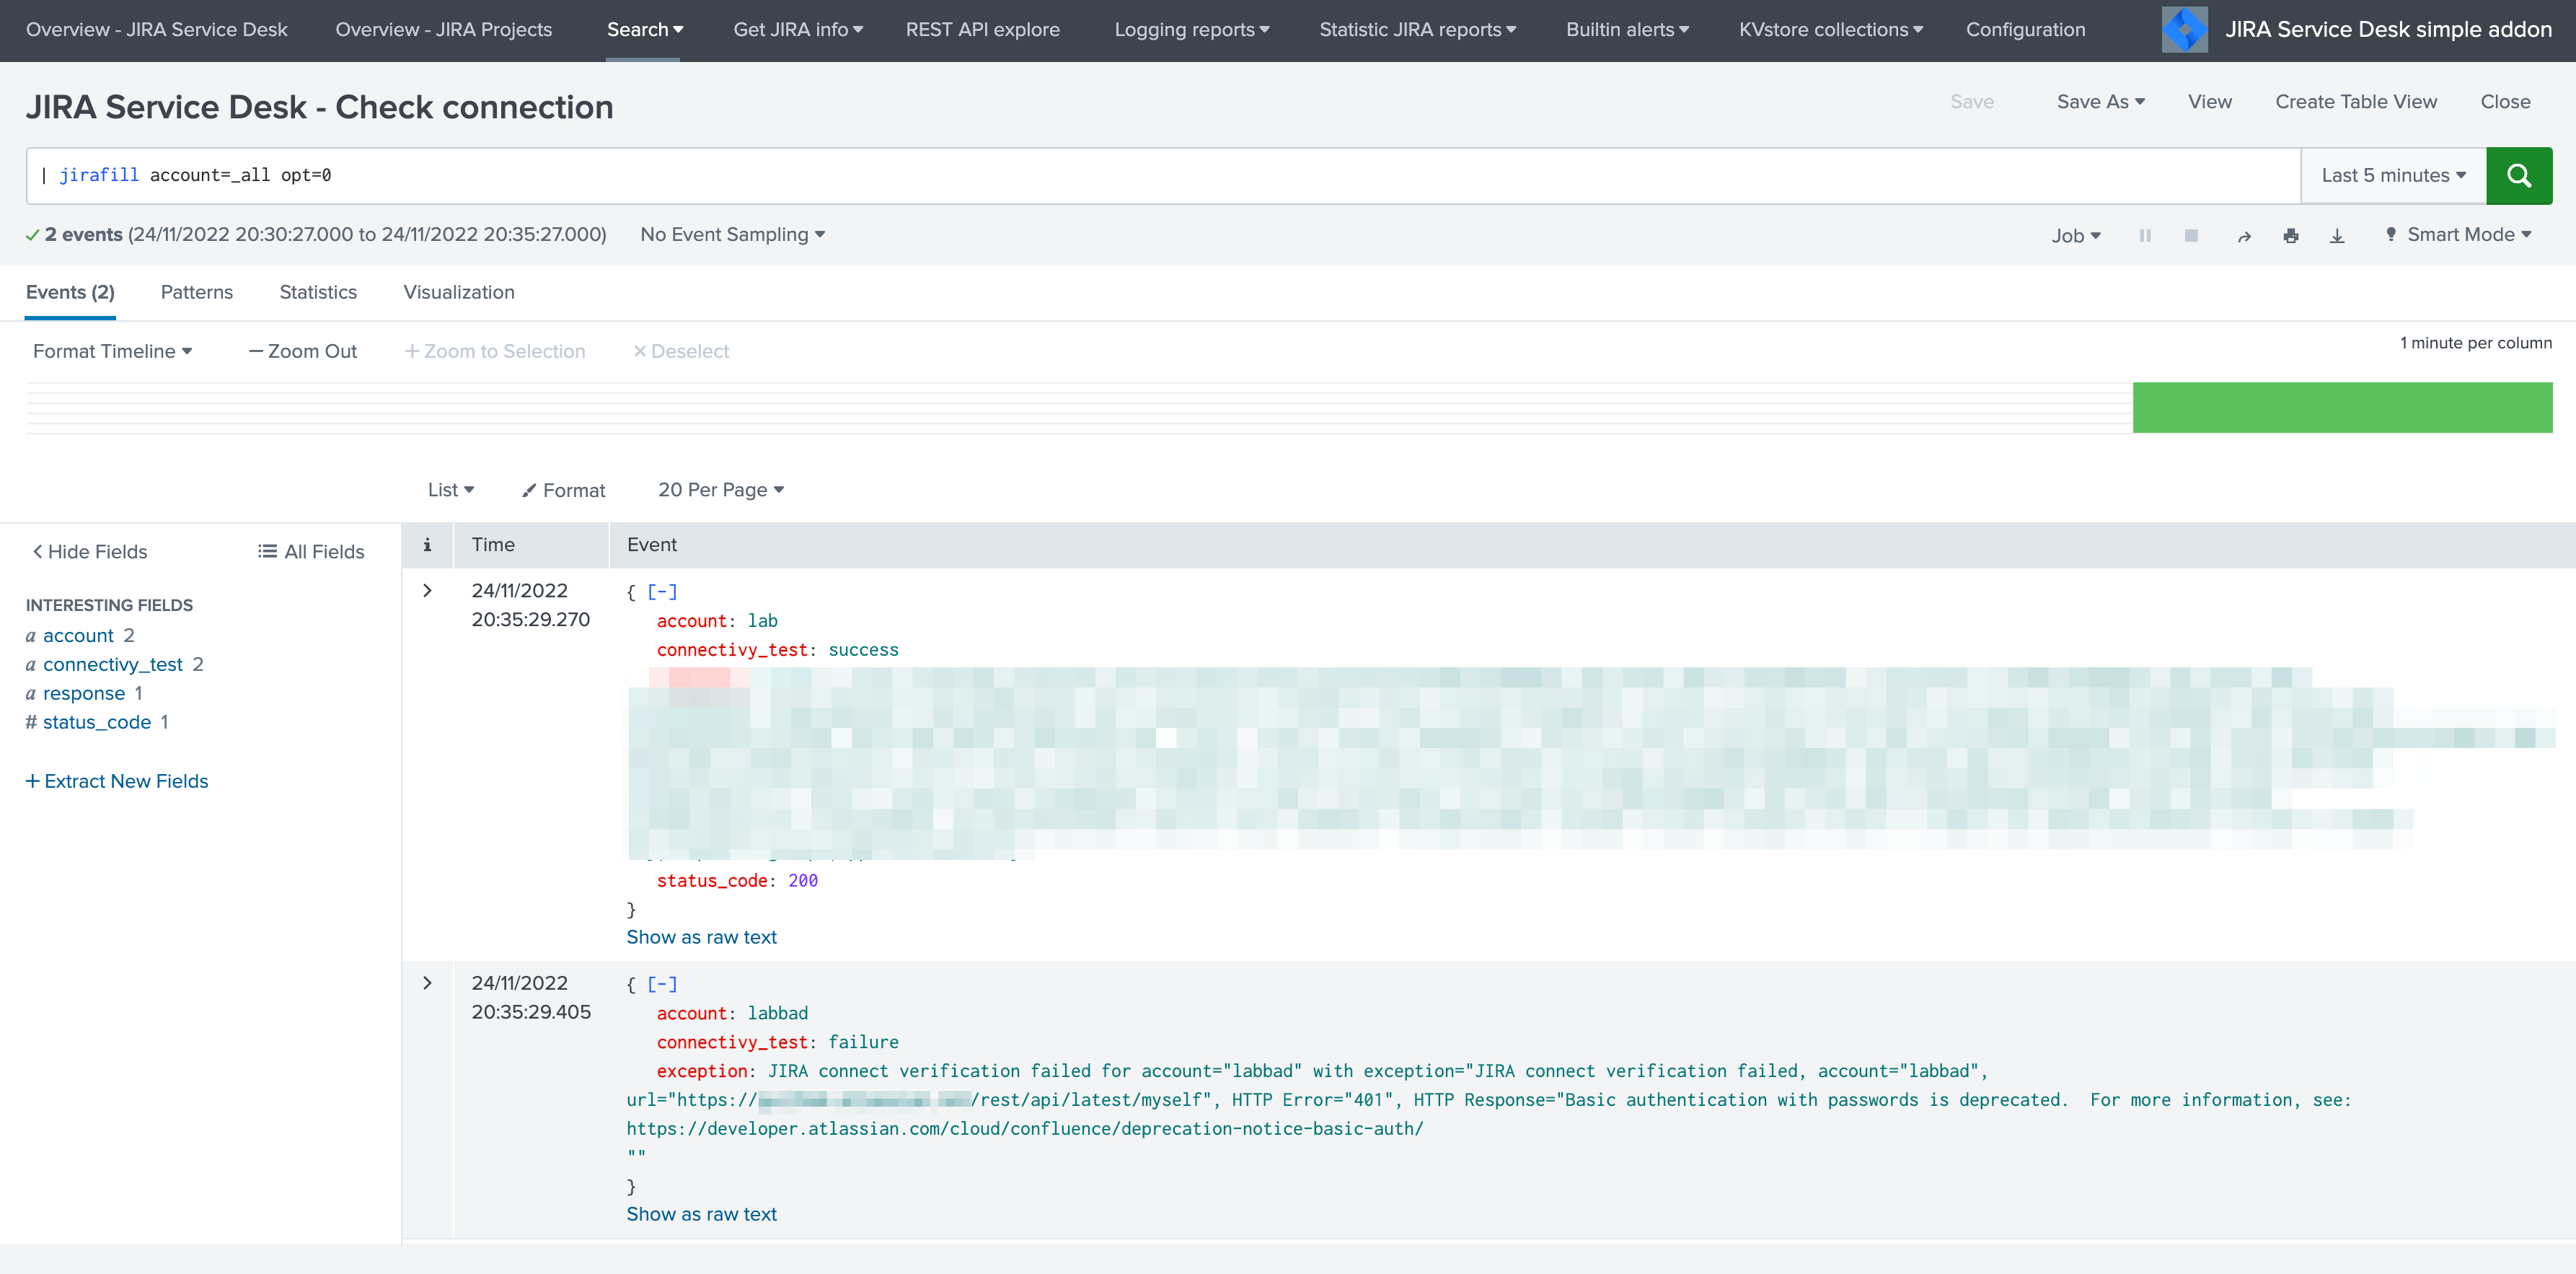
If the connectivity fails for an account, for instance due to an authentication failure or due to network connectivity issues, the command returns the reason and response.
If the connectivity to JIRA is not valid for some reasons (bad credentials, network connecttivity, etc), this will result in different Python error messages when attempting to load any of the report, load the alert action page or execute an alert action.
In such as case, the easiest way is to validate the connectivity by achieving a rest cal using the curl command in CLI, ideally in any of the search head supposed to be using the alert action. (note: this step is valid for Linux only)
curl -k https://<jira_url>/rest/api/latest/project --user <jira_username>:<jira_password>
For more information, follow these links:
Overview dashboard and Add-on logs
The Splunk Add-on for JIRA Service Desk provides a builtin Overview dashboard that gives deep insights on the Add-on activity:
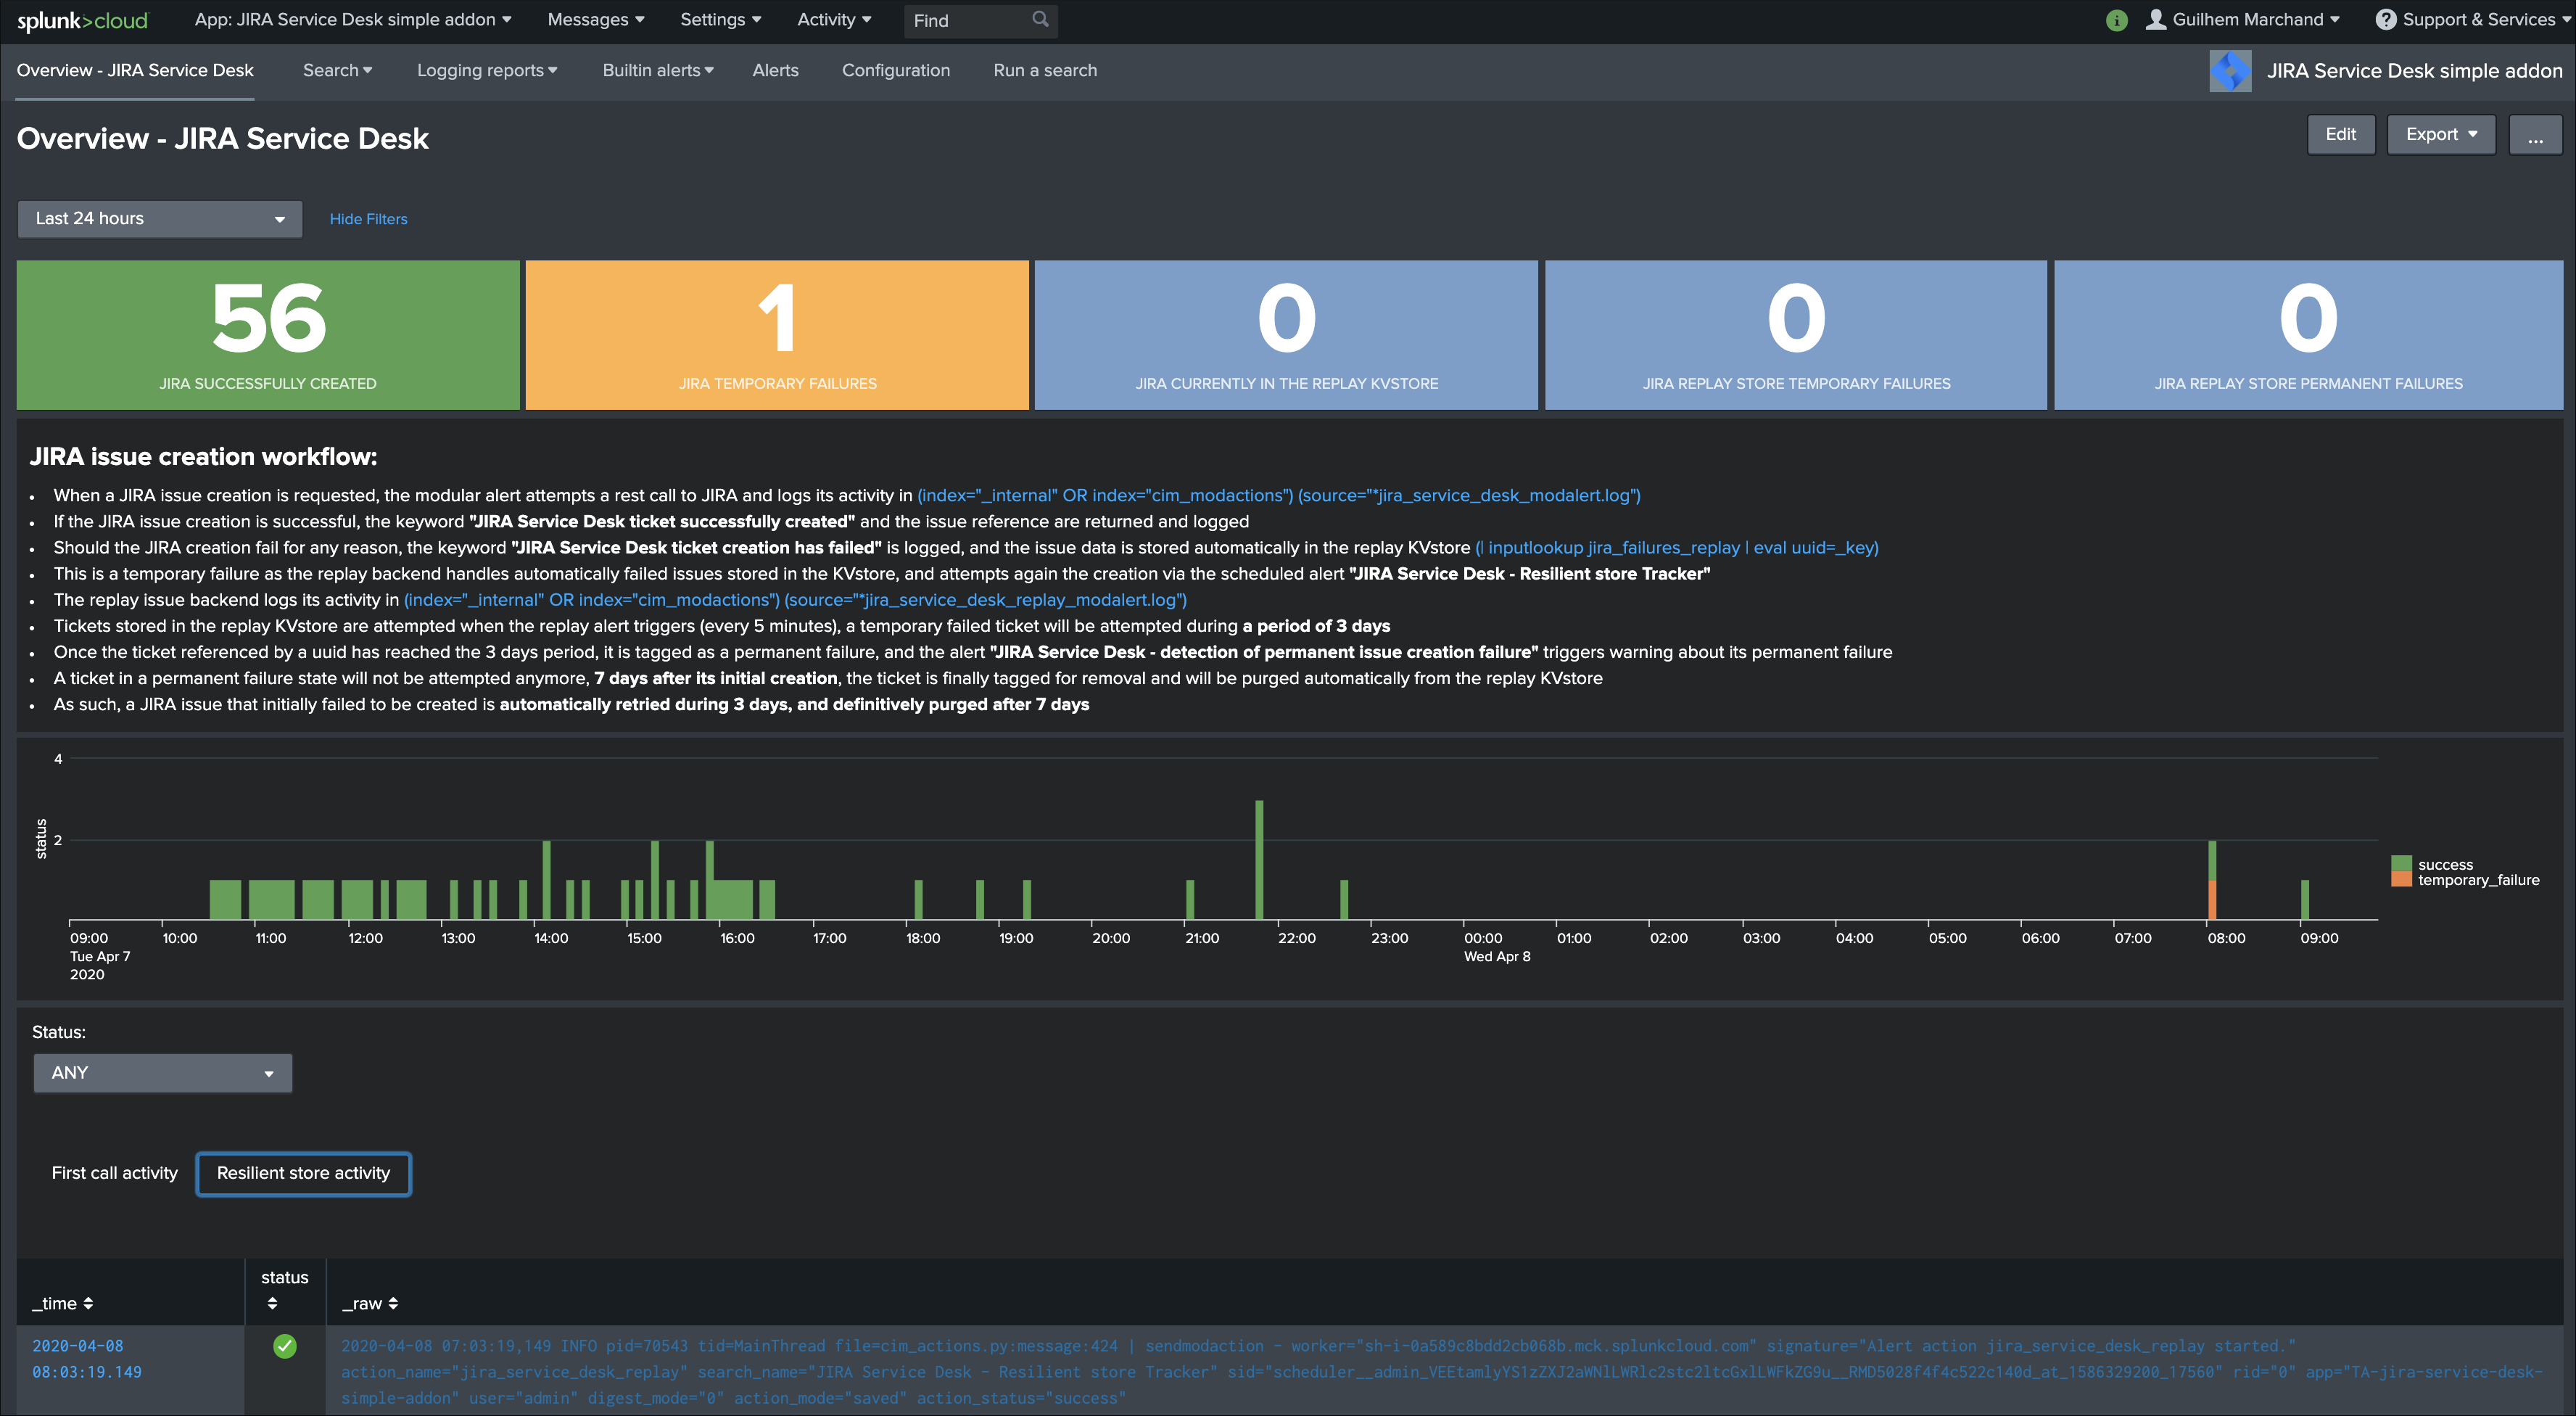
The dashboard exposes the JIRA issue workflow and direct links to access the Add-on logs.
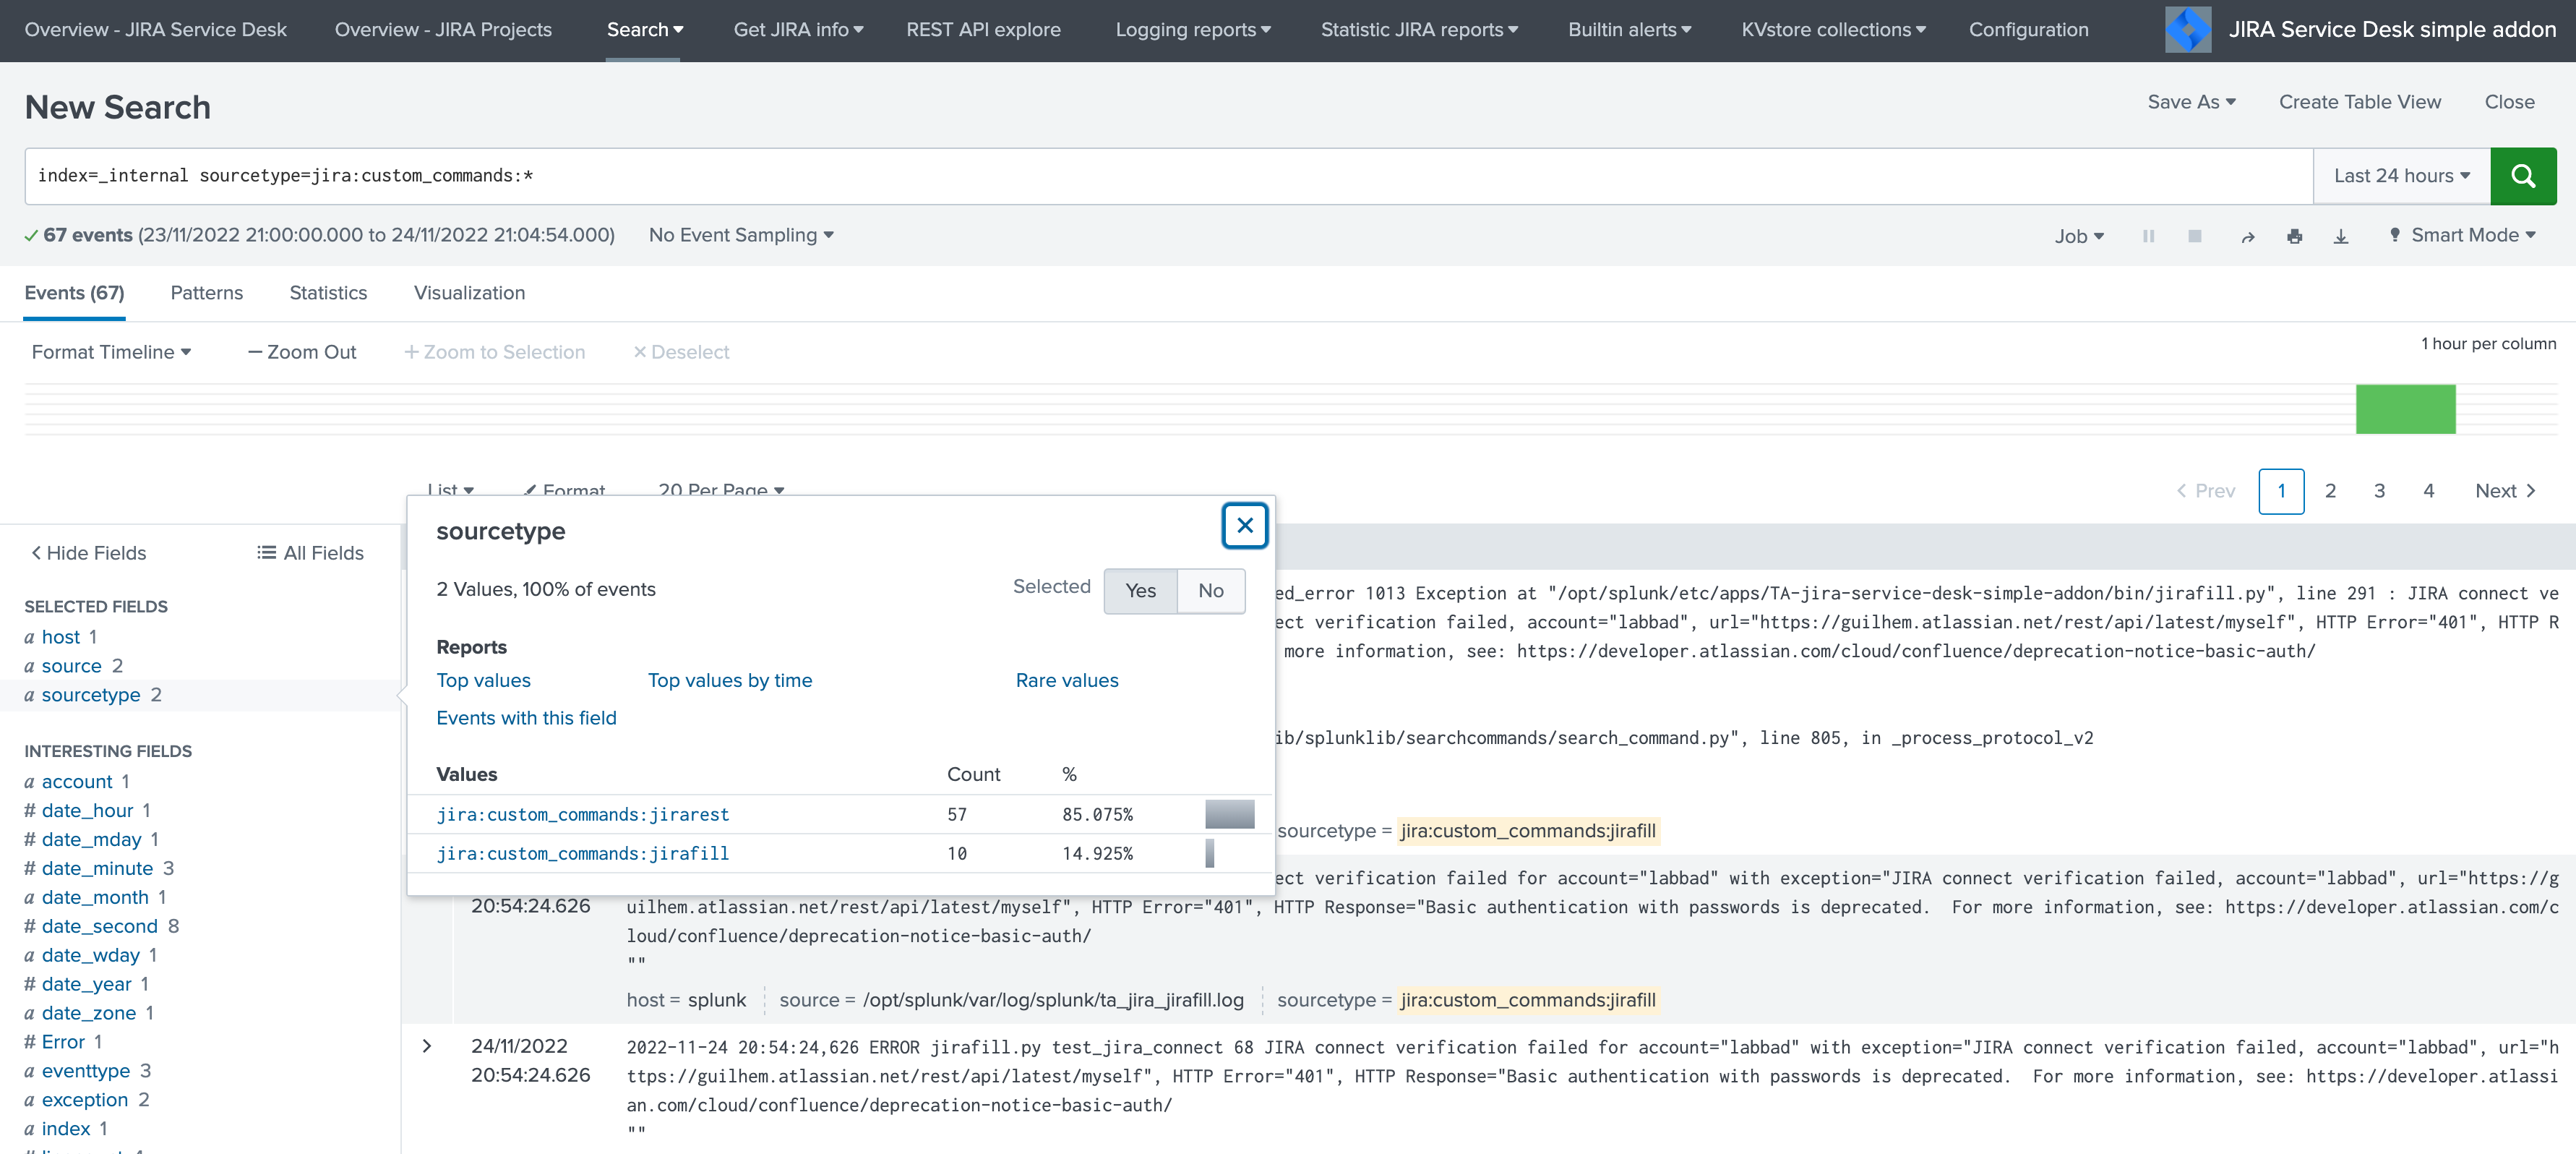
Custom command logs
All custom commands generate logs into their own dedicated log files, which are indexed automatically in Splunk:
index=_internal sourcetype=jira:custom_commands:*
Add-on logs for first REST call attempts
When the alert action is triggered, the Add-on records its activity in:
(index="_internal" OR index="cim_modactions") (source="*jira_service_desk_modalert.log")
When the JIRA issue is successfully achieved, the key sentence JIRA Service Desk ticket successfully created is logged.
If an error is encountered during the API call, the key sentence JIRA Service Desk ticket creation has failed is logged.
When the failure step is reached, for example if there is an issue with the credentials or reaching the JIRA instance, the workflow records the failure in a resilient store based on a KVstore lookup:
| inputlookup jira_failures_replay | eval uuid=_key
At this point, any failed call recorded in the KVstore is automatically re-attempted by the scheduled alert named: JIRA Service Desk - Resilient store Tracker
An out of box alert named JIRA Service Desk - detection of temporary issue creation failure is provided to monitor and track any JIRA failure, the alert is by default enabled.
Add-on logs for the resilient store feature
The resilient store feature tracks its activity in:
(index="_internal" OR index="cim_modactions") (source="*jira_service_desk_replay_modalert.log")
In normal circumstances, which means there have not been recent failed attempts, there would be no activity in this logs, nor content in the KVstore.
If a record exists in the KVstore, the Add-on will re-attempt the creation every 5 minutes during 3 days per record, if it continuously failed durant that period, a key sentence permanent failure! is logged.
An out of box alert named JIRA Service Desk - detection of permanent issue creation failure is provided to monitor and track permanent JIRA failures, the alert is by default enabled.
After 7 days in the KVstore, a record is automatically and definitively purged.
Add-on logs for the internal REST API endpoints
The application implements a REST API for different purposes, notably allowing a least privilege approach.
Access the logs:
index=_internal sourcetype=jira_service_desk:rest
Root cause for failures
Root causes of failures will be clearly exposes in the Add-on logs, most common causes could be:
JIRA credential issues (verify the connectivity, see the configuration page)
Networking issues or JIRA instance not reachable
Content issues such as JIRA fields not available on the JIRA project (make sure these fields are associated with the right JIRA screens)
Content issues such as JIRA field receiving an unexpected content or format (some JIRA fields such as date and date time inputs require a valid format, etc)
Shall a REST call for JIRA issue creation fail, the Add-on automatically logs full JSON data which you can use to easily review the data and trouble shoot the root causes.